Downloads
Orient
3.24
MacintoshMacintosh ARM
Windows
Linux
User Manual
3.22.2 beta
Windows beta3.22.1
MacintoshMacintosh ARM
Windows
Linux
User Manual
3.22.0
MacintoshMacintosh M1
Windows
Linux
3.21.0
MacintoshMacintosh M1
Windows
Linux
3.20.0
MacintoshMacintosh M1
Windows
Linux
Links
HomeEllipseFit
Antevs
Donate
 Orient is a fast, easy to use, professional spherical projection and data analysis program. In 1986 Orient introduced modified Kamb contouring, triangular fabric diagrams, orientation fields, and automated structural domain analysis. Orient has constantly evolved, with numerous new and updated tools, including interactive data analysis, UTM coordinate conversions, digitizing, bootstrap statistics, cluster analysis, ternary plots, fault kinematic and stress inversion, rotation plots, and file level integration with applications and databases such as Microsoft Excel, LibreOffice, Adobe Illustrator, InkScape, CorelDRAW, StraboSpot, Global CMT Project, and Google Earth.
 Orient is for plotting and analyzing directional data, data that can be described by an axis or direction in space. Examples of such data include geologic bedding planes, fault planes and slip directions, fold axes, paleomagnetic vectors, glacial striations, current flow directions, crystallographic axes, earthquake epicenters, cosmic ray arrival directions, comet orbital planes, and animal migration paths. Additionally, plots and statistics for line in plane orientation data, such as LS tectonites and kinematic data, are supported. Orient has been written to apply to a wide variety data types, however many examples come from geology, which requires extensive manipulation and analysis of orientation data.
 Spherical projections are used to display three dimensional directional data by projecting the surface of a sphere, or hemisphere, onto a plane. Lines and planes in space are considered to pass through the center of a unit sphere, so lines are represented by two diametrically opposed piercing points. Planes are represented by the great circle generated by their intersection with the sphere or, more compactly, by their normal. Data input formats include longitude and latitude, azimuth and altitude, declination and inclination, trend and plunge, strike and dip, dip and dip direction, and others.
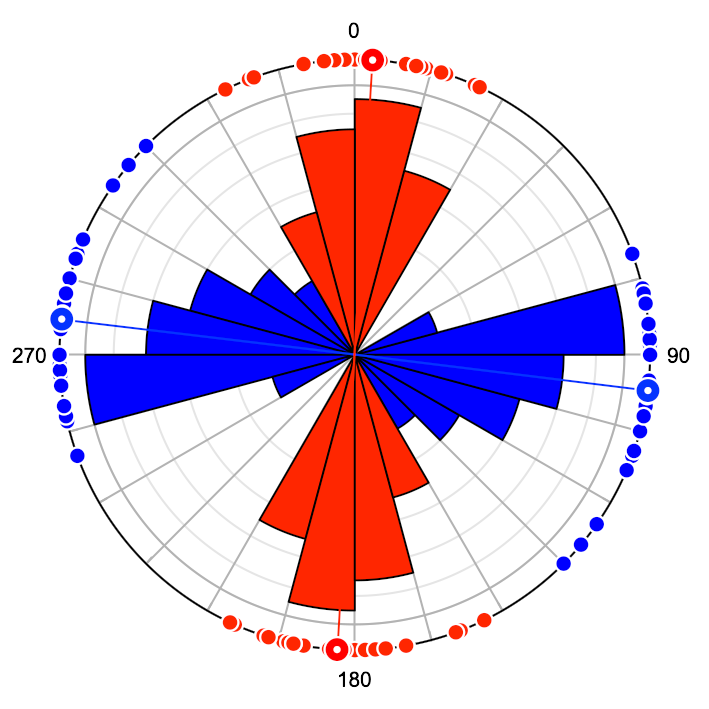
 Spherical projections include equal-area (Schmidt net), stereographic (Wulff net or stereonet), orthographic, and equidistant projections. These can be plotted on either hemisphere, or transparency can be used to display both hemispheres. Point distributions are analyzed by contouring, and by computing eigenvectors or vector means. Statistical analysis includes confidence cones based on Fisher, Kent, Watson, and Bingham distributions, bootstrap statistics, and small circle or spherical ellipse fitting. Data and projections can be rotated about any axis in space, to principal axes, or by live interactive rotation. Several types of rotation plots are implemented for displaying orthogonal frames derived from line in plane data. For two-dimensional data, such as wind or current directions, circular plots and circular histograms, including equal-area and frequency polygon diagrams, can be prepared.
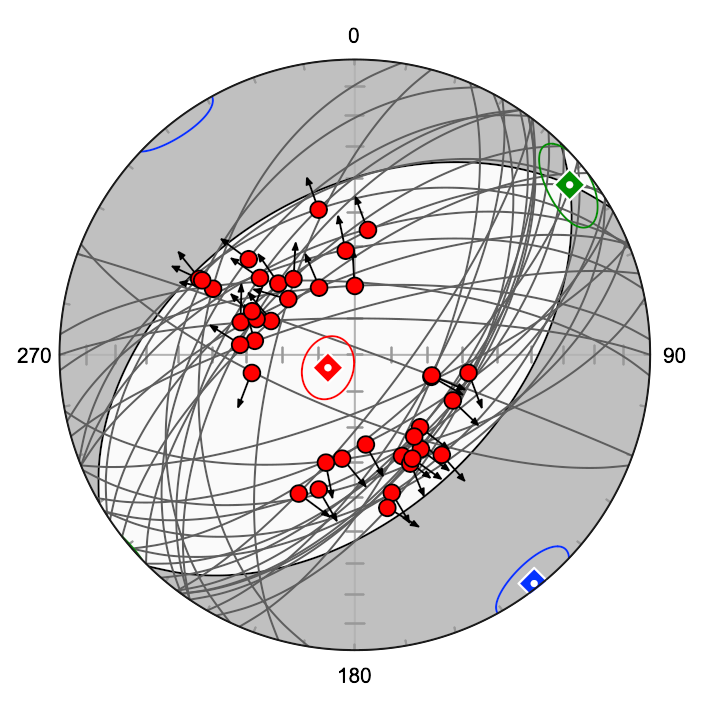
 Kinematic and dynamic analysis of fault data includes the generation of P and T moment tensor axes, tangent line diagrams, and beachball plots. Best fit P and T axes and confidence intervals can be determined for kinematic analysis, dynamic fault analysis includes Coulomb stress inversion, and reduced stress tensor inversion. Fault planes can be weighted using earthquake magnitude, gouge thickness, known displacements, or other factors. Fault data can be plotted on quarter dip histograms, rake plots, and moment tensor triangle plots. Kinematic data can also be treated as orientation frames, allowing the plotting and statistical analysis of the data treated as line in plane data.
Spherical projection functionalities include:
- Schmidt net (equal-area) spherical projections
- Stereonet (Wulff) spherical projections
- Upper, lower, and dual hemisphere projections
- Modified Kamb contouring of density on the sphere
- Density, MUD, and probability contour intervals
- Eigenvector and mean vector calculations
- Fisher, Kent, Watson, and Bingham confidence cones
- Bootstrap confidence cones
- Data, net, and projection rotations
- Best fit circular cones with confidence
- Best fit elliptic cones with confidence
- Kinematic and dynamic fault and shear zone analysis
- Axis, vector, and girdle cluster analysis
- Spherical kernel density estimation
- Slope stability plots
 Additional functionalities include:
- Triangular eigenvector PGR fabric plots
- Rotation plots and statistics of line in plane frames
- Circular histograms and frequency polygons
- UTM, latitude, longitude conversions
- Digitizing directional data from maps and projections
- Fault quarter dip and rake histograms
- Fault moment tensor triangle plots
- Trend surface analysis
- Google Earth, StraboSpot, and Global CMT Project integration
- Orientation fields and structural domain analysis
- Terzaghi scan line weight correction
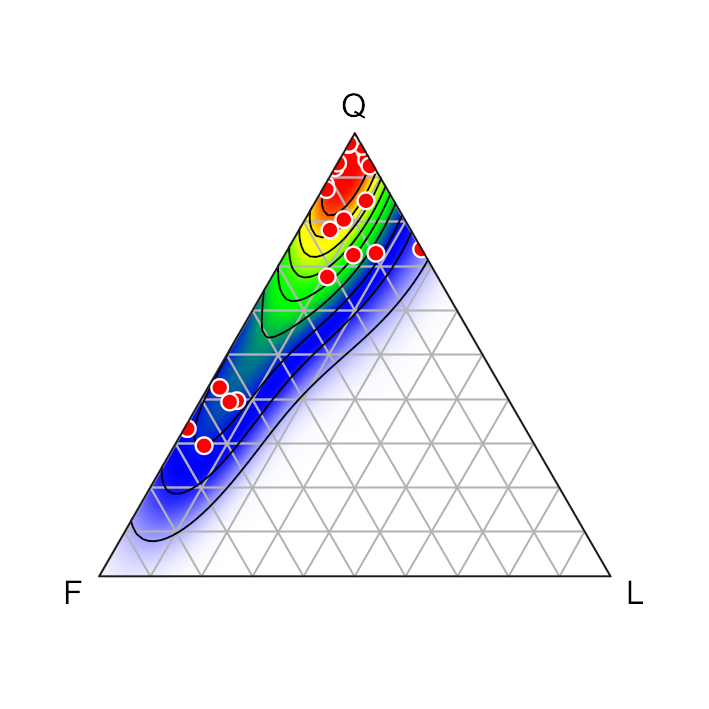
- Ternary compositional plots (e.g., QFL plots)
- Triangular kernel density estimation
Orient is compiled and tested on Macintosh macOS, Windows, and Linux Ubuntu 64 bit distributions. For installation, download the version for your computer using the links in the sidebar (.dmg, .zip, or .tar.gz), and follow the instructions below. There are two versions for macOS, the Intel version that runs on macOS 10.6 and newer, and a macOS ARM version that only runs on the newer M1+ Macs. See the User Manual for additional details.
 On macOS, double click the disk image file (.dmg), and drag the Orient application onto the Applications folder icon, or to any other desired location. If you get an App Can’t Be Opened message, right-click on the Orient icon, and choose Open from the popup menu. macOS must be configured to allow applications other than from the Mac App Store to be opened. To do so, open the System Preferences and the Security & Privacy option. Under General select Allow apps downloaded from: Anywhere.
On Windows, unzip the zip file (.zip) using the Extract All option, and drag the Orient application (Orient.exe) to any desired location. Make sure to entirely extract the Orient application from inside the .zip file, this is the most common installation problem.
 On Linux Ubuntu unpack the tar gzip file (.tar.gz), and copy the Orient application (orient) to any desired location.
Orient comes with numerous tutorials in the User Manual to get you up to speed quickly. The Example Data folder should also be copied for use in the tutorials. To deinstall simply delete the Orient application folder, and optionally the preference files. No other files are installed on your computer. No administrative permissions are required to install Orient.
Orient has been used for numerous scientific and technical papers, reports, books, and workshops. It is completely free, and an open source version is in progress on GitHub. The only stipulation is that use of the software in analyzing data or preparing diagrams be cited in publications, presentations, reports, or other works. Donations are welcome to help support the project, which is otherwise entirely funded by the author. Please see the User Manual for additional details and license.
© 2012-2024 F.W. Vollmer